Look inside
介面預覽
The dashboard as it actually renders, in English — the layout is the same in 繁體中文 and 简体中文. Screenshots use sample data, not real holdings.
實際渲染的介面(英文)— 繁體中文/简体中文 版面相同。截圖使用示範資料,非真實持倉。
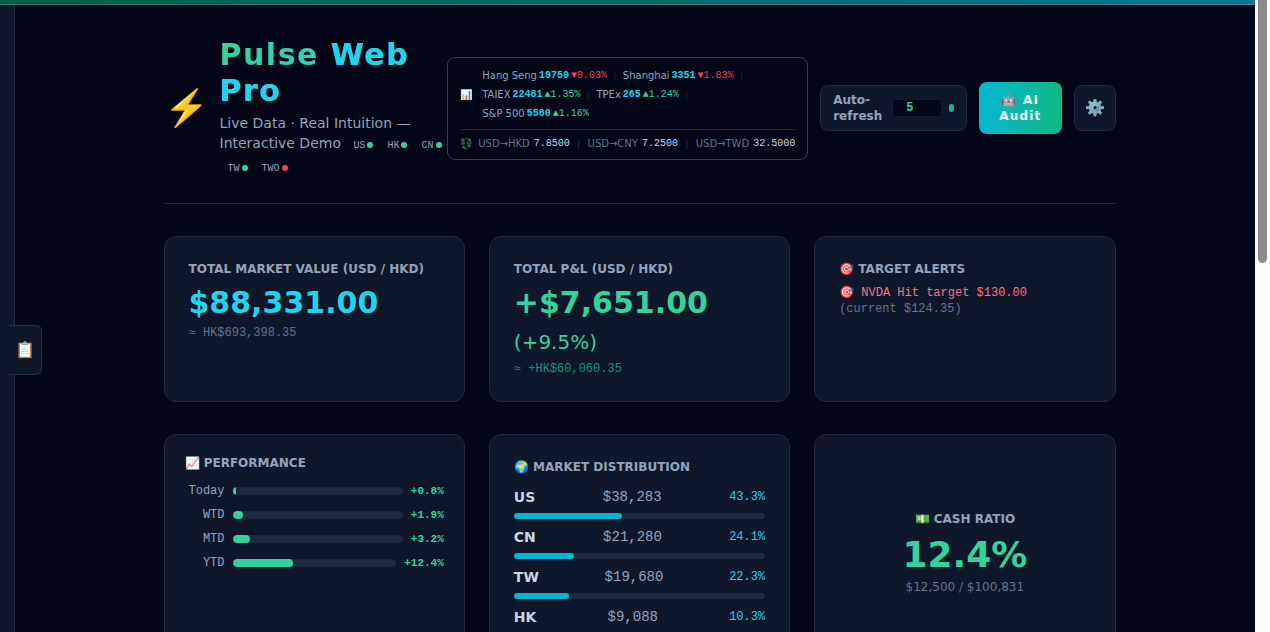
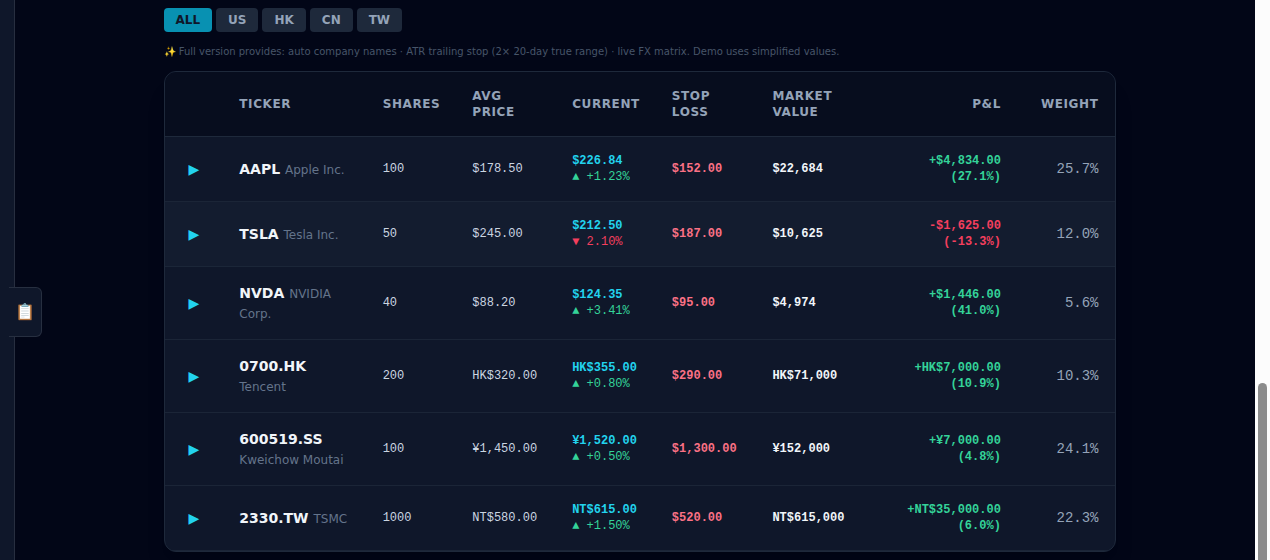
Self-host your portfolio. Your data stays on your machine. No cloud lock-in, no subscriptions — just powerful portfolio tracking that you control.
自託管你的投資組合。數據留在你的硬碟。無雲端鎖定、無月費 — 你完全掌控的投資追蹤工具。
Everything you need to track your portfolio — all running on your machine.
追蹤投資組合所需的一切 — 全在你的機器上運行。
US · HK · CN · TW — real-time prices
美 · 港 · 滬深 · 台 即時報價
Market value, P&L, ROI, ATR stop-loss, capital recovery tracking
市值、盈虧、ROI、ATR 移動止蝕、本金收回追蹤
Drag-and-drop groups, multi-market tickers
拖曳分組、多市場代碼
Today · WTD · MTD · YTD returns at a glance
Today · WTD · MTD · YTD 一目了然
JSON backup. Move data freely between the self-hosted build and the Web version.
JSON 備份。自託管版 ↔ Web 版自由遷移。
繁體中文 · 简体中文 · English — switch anytime
繁體中文 · 简体中文 · English — 隨時切換
The dashboard as it actually renders, in English — the layout is the same in 繁體中文 and 简体中文. Screenshots use sample data, not real holdings.
實際渲染的介面(英文)— 繁體中文/简体中文 版面相同。截圖使用示範資料,非真實持倉。
Twelve features planned across the self-hosted, desktop and Web builds
十二項功能即將登陸自託管、桌面及 Web 版本
Per-ticker news feed on detail & watchlist. No noise — only the stocks you track.
明細頁與自選股的個股新聞。只顯示你追蹤的股票,不雜亂。
Responsive layout. Check your portfolio on the go.
響應式版面。隨時隨地查看投資組合。
LLM-powered sentiment & risk summary from your saved news. Bring your own key.
LLM 驅動的情緒與風險摘要,來自你儲存的新聞。自備 API Key。
Manage multiple portfolios. Switch with one click. Aggregate view across accounts.
管理多個投資組合。一鍵切換。跨戶口總覽。
Plug in Finnhub, Tiingo, or any API. Faster updates, more data. Adapter system included.
接入 Finnhub、Tiingo 或任何 API。更新更快,數據更多。內建 adapter 架構。
Candlestick charts with moving averages, RSI, MACD — timing made visual.
K線圖搭配均線、RSI、MACD — 買賣時機一目了然。
Target allocation rebalancing, if-then condition rules, AI-generated trade suggestions. You confirm, you execute.
目標配置再平衡、條件觸發規則、AI 交易建議。你確認,你執行。
A plain-language read of your portfolio — positions, P&L and market mix summarised for you.
以淺白語言說明你的投資組合 — 持倉、盈虧、市場分佈。
Write your own analysis prompt instead of the built-in styles.
自行撰寫分析 prompt,不限於內建風格。
Market distribution, cash ratio and position weight — the full picture next to your P&L.
市場分佈、現金比率、持倉權重 — 與盈虧一併查看全局。
A note in the dashboard when a position reaches the target price you set for it.
持倉到達你自行設定的目標價時,會在儀表板提示你。
Upload your own dashboard background. Dark-mode friendly.
上傳自己的儀表板背景圖,深色模式友善。
| Self-Hosted | 自託管 | Web Free | Web 免費 | ||
|---|---|---|---|---|---|
| Multi-market tracking | 多市場追蹤 | ✓ | ✓ | ||
| Watchlist | 自選股 | ✓ | ✓ | ||
| Performance cards | 投資表現卡 | ✓ | ✓ | ||
| Import / Export | 導入/導出 | ✓ | ✓ | ||
| 3 languages | 三語介面 | ✓ | ✓ | ||
| Data location | 數據位置 | Your machine | 你的機器 | Cloud | 雲端 |
Self-Hosted is free and open source — run it with Docker or Python on your own machine. The public repository ships the Free edition; the analysis features are still in development.
自託管免費開源 — 用 Docker 或 Python 在自己的機器運行。公開 repo 提供的是 Free 版本;分析功能仍在開發中。
No cloud lock-in. No subscriptions. Just you and your data.
無雲端鎖定。無月費。只有你,和你的數據。